Work In Progress
Revisiting Public Opinion in the Coupled Climate-Social System: Climate Opinion with the Receive-Accept-Sample Model
Frances Moore and Kayla Lunde
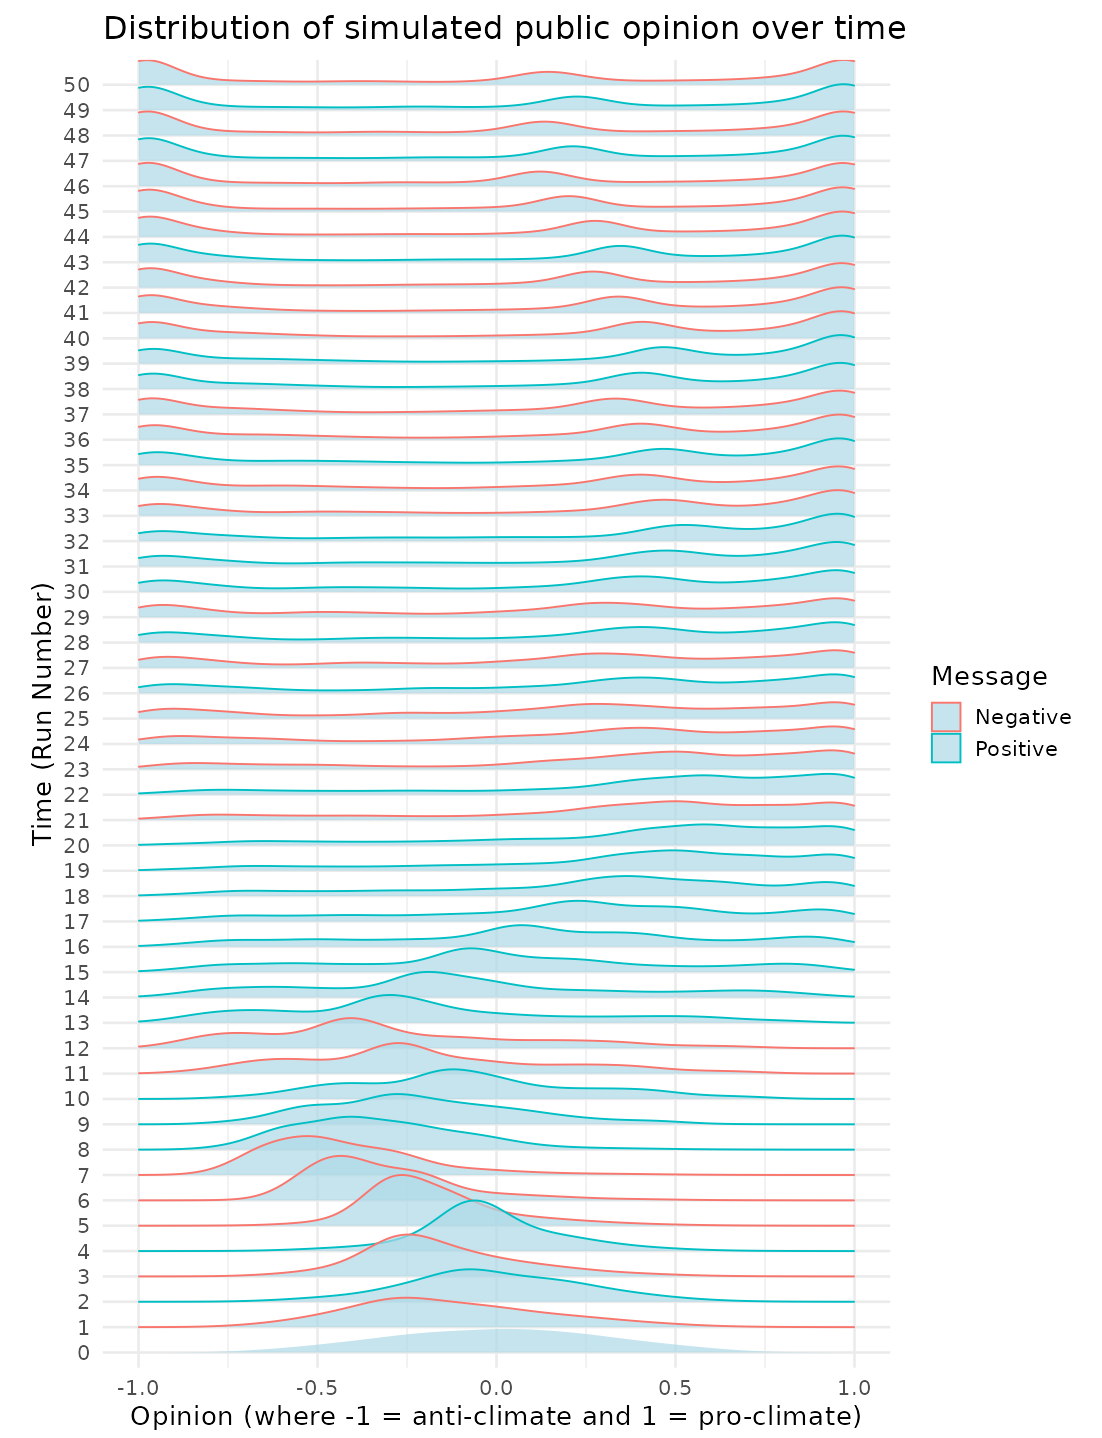
Almost all climate modeling ignores the political and social processes that impact climate policy and emissions trajectories, treating them as exogenous. We revisit Moore et al. (2022), which developed a stylized model of the climate–social system that incorporated relevant social and political feedbacks. This paper updates the public opinion component using Zaller’s Receive-Accept-Sample (RAS) model. We adapt the RAS model to take messages over time from the climate, the economy, and social groups determined by other components of the model. After containing the model, we simulate future opinion, policy, and emissions trajectories. In these simulations, we frequently observe opinion polarization over time, impacting policy enactment. Our findings suggest that public perceptions of climate change remain an important determinant of emissions pathways.
Predicting Climate Attitudes One Branch at a Time: A Machine Learning Derived Composite Measure
Kayla Lunde
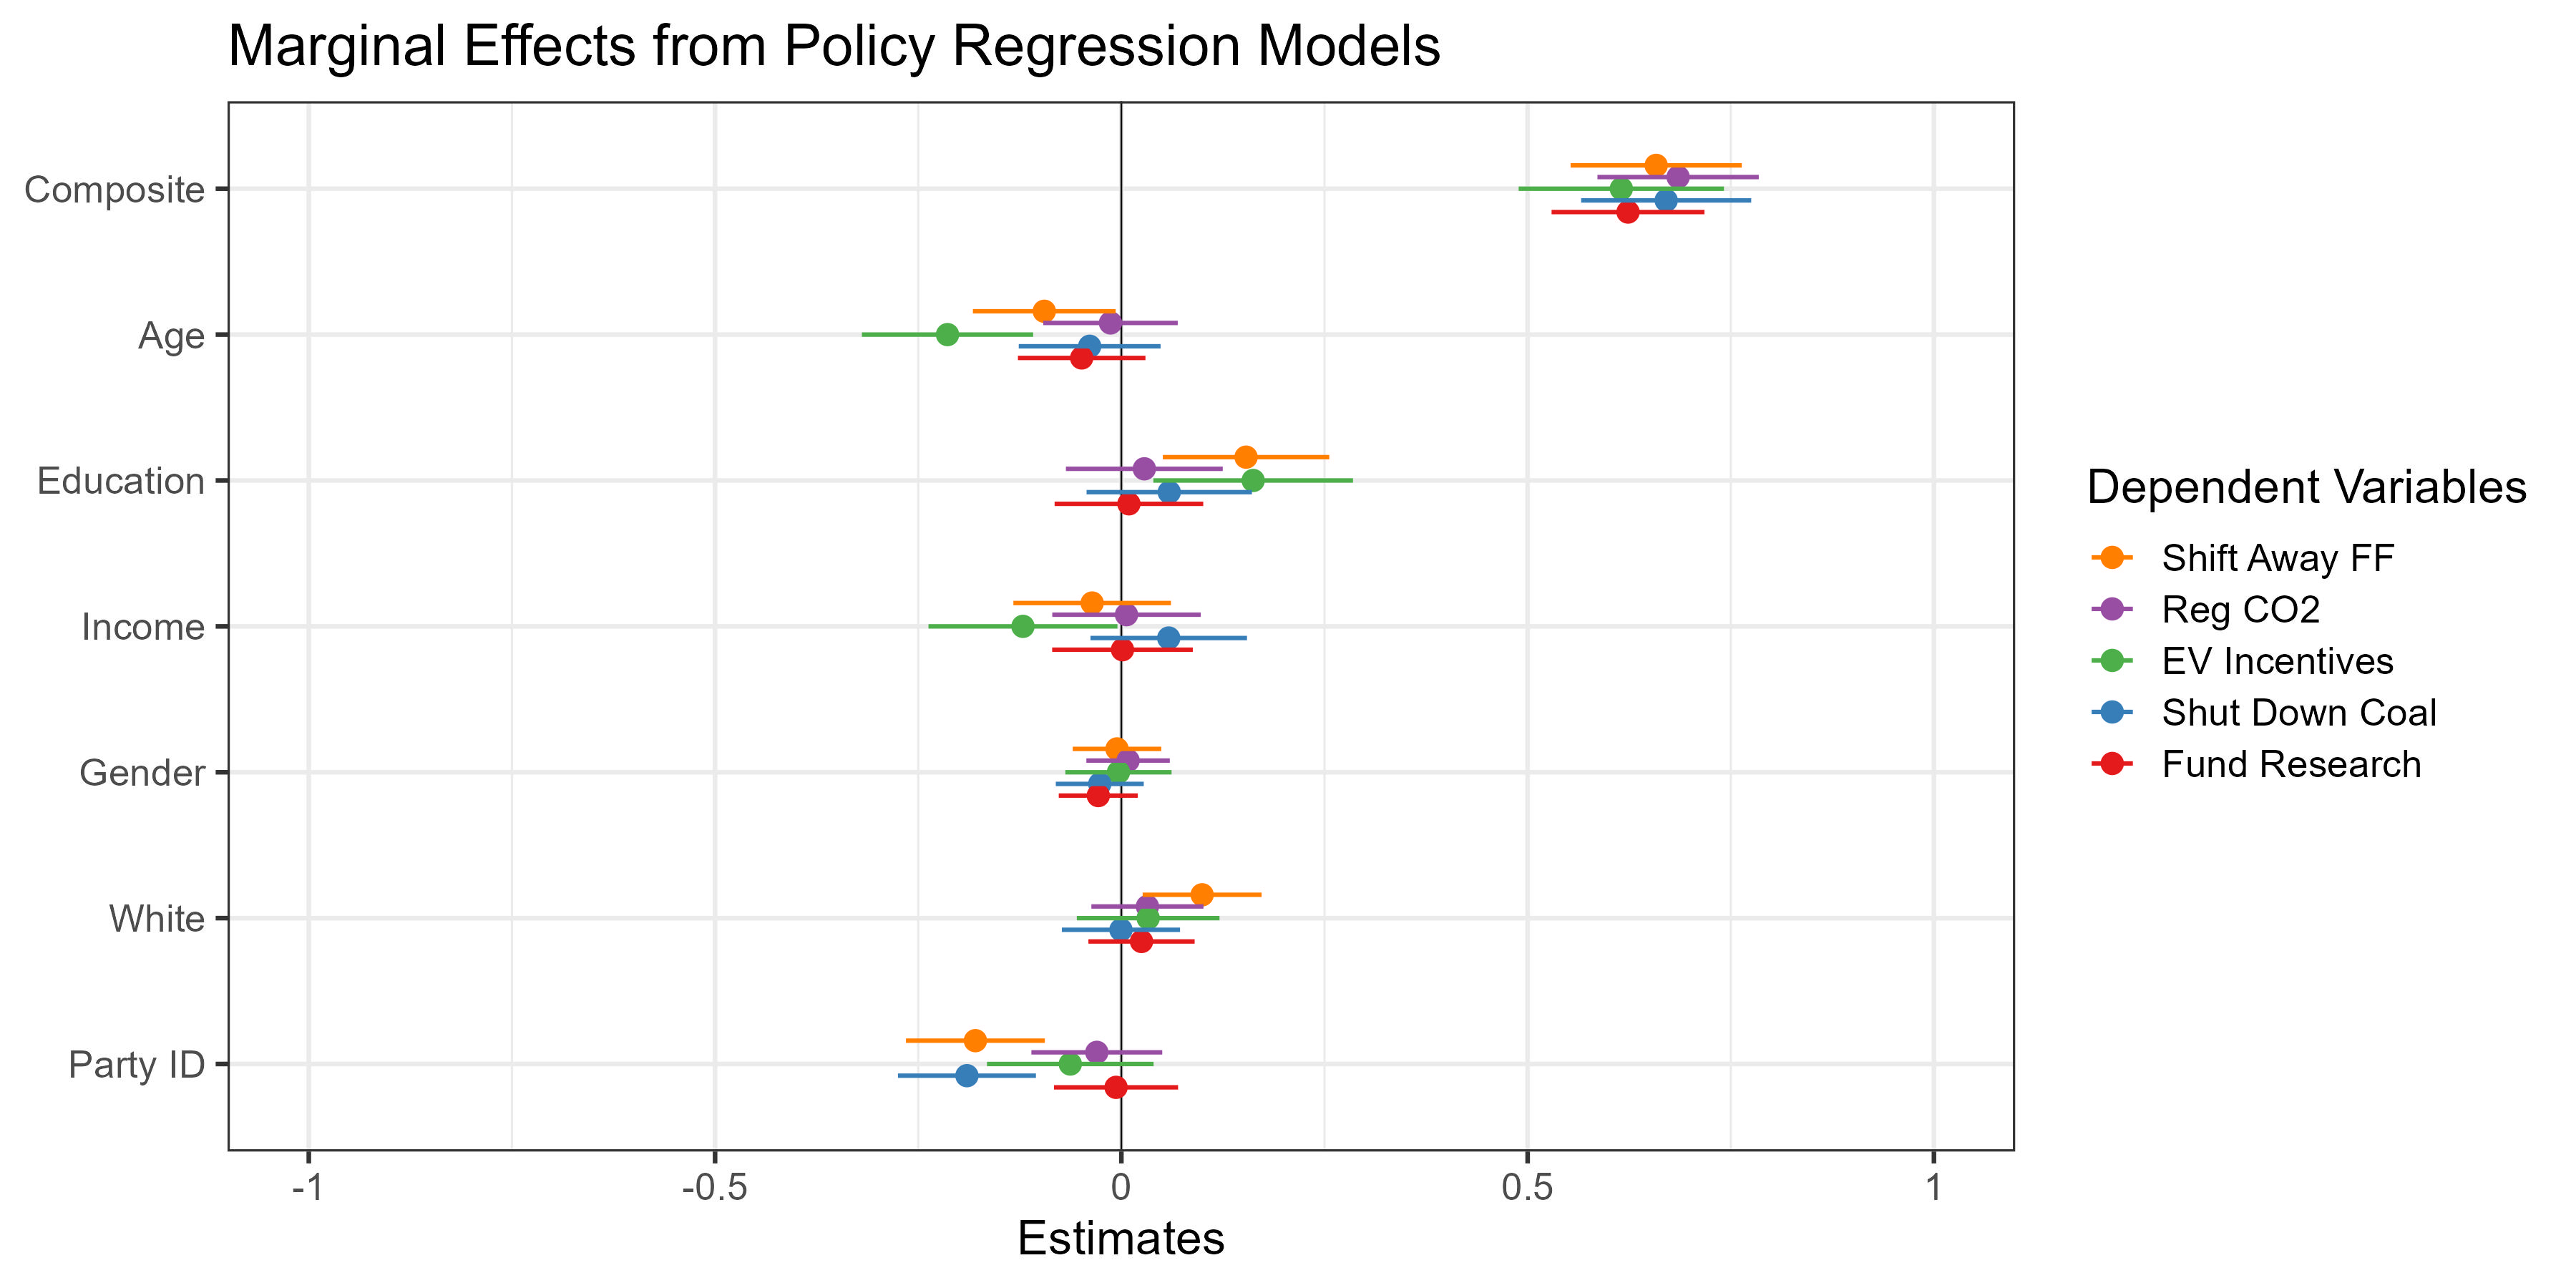
Understanding the state of public opinion on climate change is important for policy planning. In most western democracies, climate action is supported across political parties to varying degrees. However, unique to US politics, is a conservative party not only resistant to change but regularly in denial. This dynamic means that the limiting factor of climate solutions is likely to be dependent on first the electoral success of the Democratic party and second on the internal priorities of the Democratic party. Thus, it is important to identify within party differences in climate attitudes among Democratic partisans. Current measures of climate attitudes in surveys are not sensitive enough to fully examine differences in policy support. Utilizing data from an original survey, I overcome this limitation by building a new composite variable for climate attitudes. I use random forests to find combinations of survey items that scale together in order to create a more sensitive measure that can capture intraparty differences in climate attitudes.
The Party of a Future Nonreligious Majority: The Secular Religious Cleavages in the Democratic Party
Spencer Kiesel and Kayla Lunde
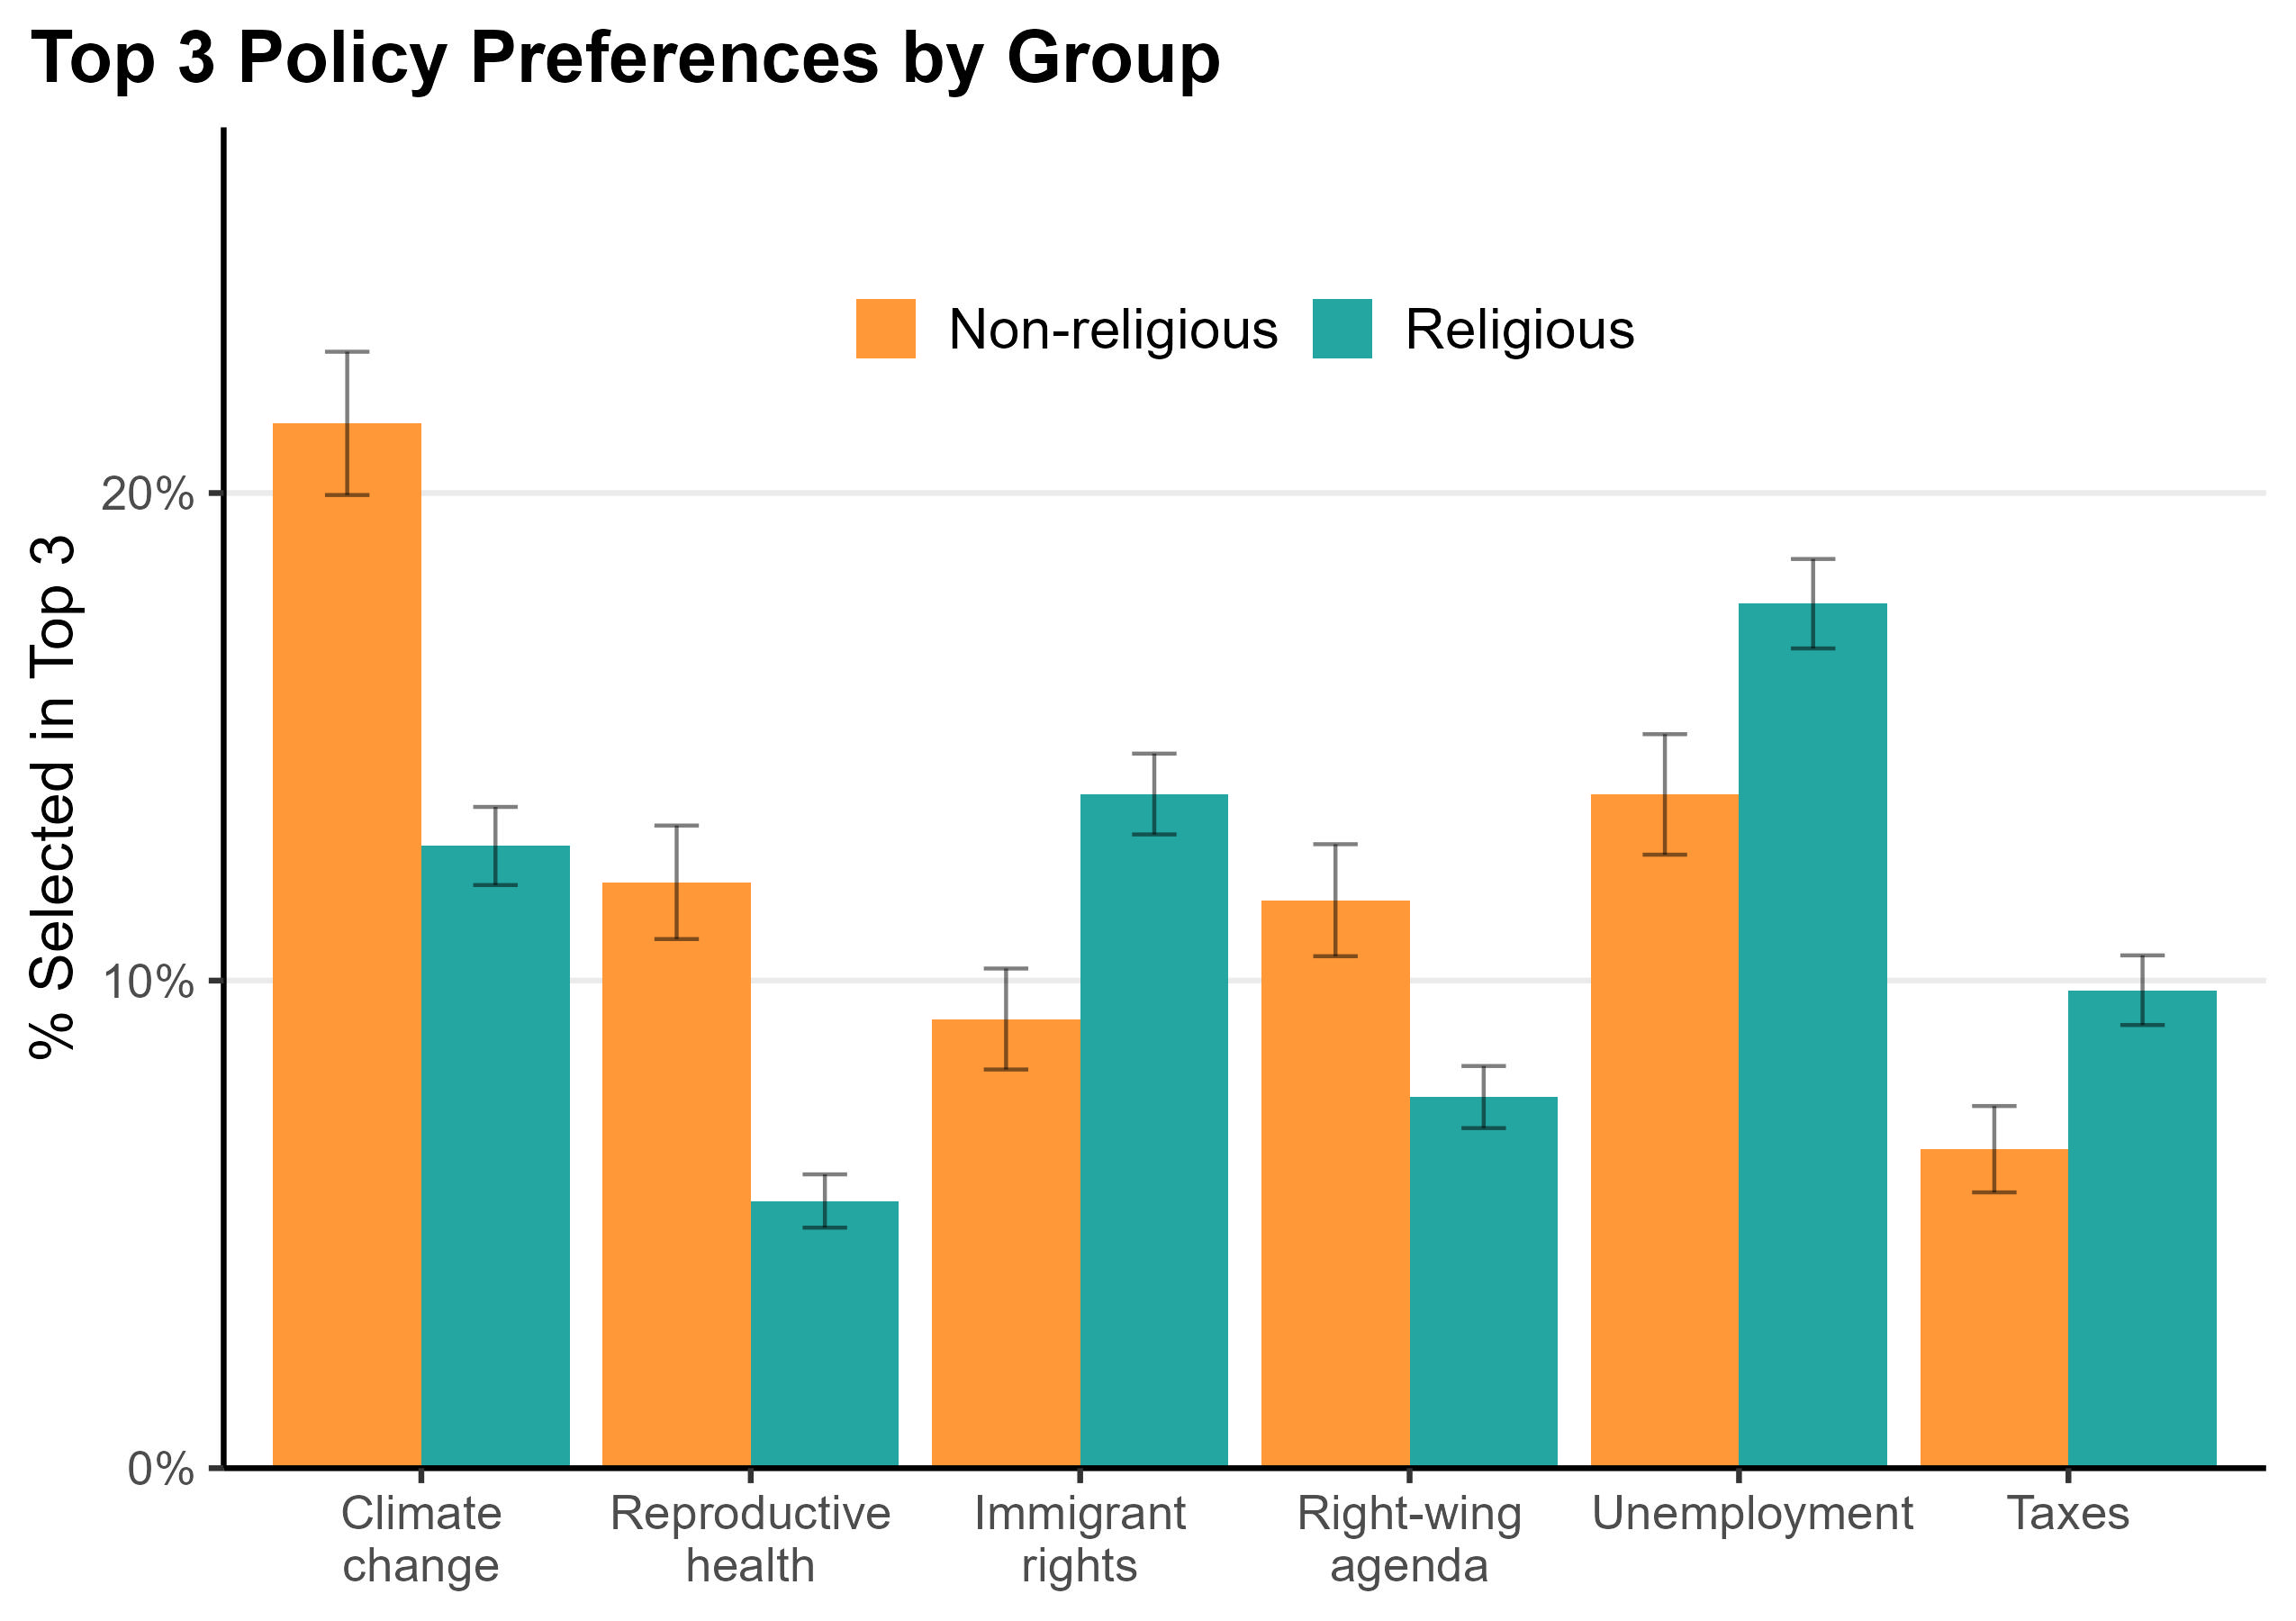
The Democratic Party has for decades been the preferred choice of Americans who are openly secular or nonreligious. Furthermore, the nonreligious are projected to become a majority of the county between 2030 and 2050 (Pew Research Center 2022) but will likely be a majority of the Democratic party much sooner. Yet nationally elected Democrats are overwhelmingly religious, as only one sitting member of Congress identifies as explicitly nonreligious. To explain the disparity between widespread nonreligious identification among Democratic voters and near universal religious identification among elected Democrats, this study examines systematic differences in the policy beliefs and levels of participation of nonreligious and religious Democrats. Utilizing data from the 2020 Collaborative Multiracial Post-Election Survey, we find significant differences in voice and equality between secular and religious Democrats. In general, respondents who identify as Democrats and are religiously affiliated, have higher levels of political participation than the religiously unaffiliated. Furthermore, the less involved nonreligious Democrats have a distinct set of policy preferences and select different issues as their primary policy concerns. Our findings may explain, in part, why the nonreligious are vastly underrepresented in government despite comprising a third of the population and an even larger portion of the Democratic Party’s coalition.